The concept and why we do it
Features are important to a business, but equally, so is performant code. At Just Eat, we’re introducing the concept of Load-test driven development to produce not only functional code but performant code. Load-test driven development (LTDD) is the concept of using load-testing to test and iterate through software versions. Rather than solely prioritising the functional requirements, we place the non-functional requirements as an equal priority from the start.
At Just Eat, we are used to working with large volumes of traffic on a global scale so getting this right is crucial. Imagine this scenario: You’ve just been working on a medium-long term project creating a new API or Microsite. You’re trying to progress the tech stack of the business and implemented a new architecture. It meets the functional needs of the business well. As you start to integrate the new API, it struggles to cope with the large volumes of traffic. Using LTDD, we aim to mitigate this issue early in development.
Reasons we’ve used LTDD:
- It gets us thinking of scale from the start.
- To test architectural decisions as a proof of concept before committing and finding problems later in production.
- To influence the decision to use an entirely new framework & server-side rendering approach.
- To ensure our endpoints are scalable and reliable.
- To help inform decisions around the correct instance size and scaling policies for a component.
Our first experience of this methodology was used to find the performance difference between .NET core and Node to make network calls to a CDN. We soon learnt that the LTDD approach was greatly influential on our decision, with early attempts causing our AWS instances to run out of memory under load (fig 1). This was due to a memory leak that would not have been noticed through solely local/functional testing. As we tested the different configurations and continuously optimised our code, the load testing helped prove the application was stable, whilst identifying some serious bottlenecks early on.
Figure 1: An early .Net/Node proof of concept struggling under load
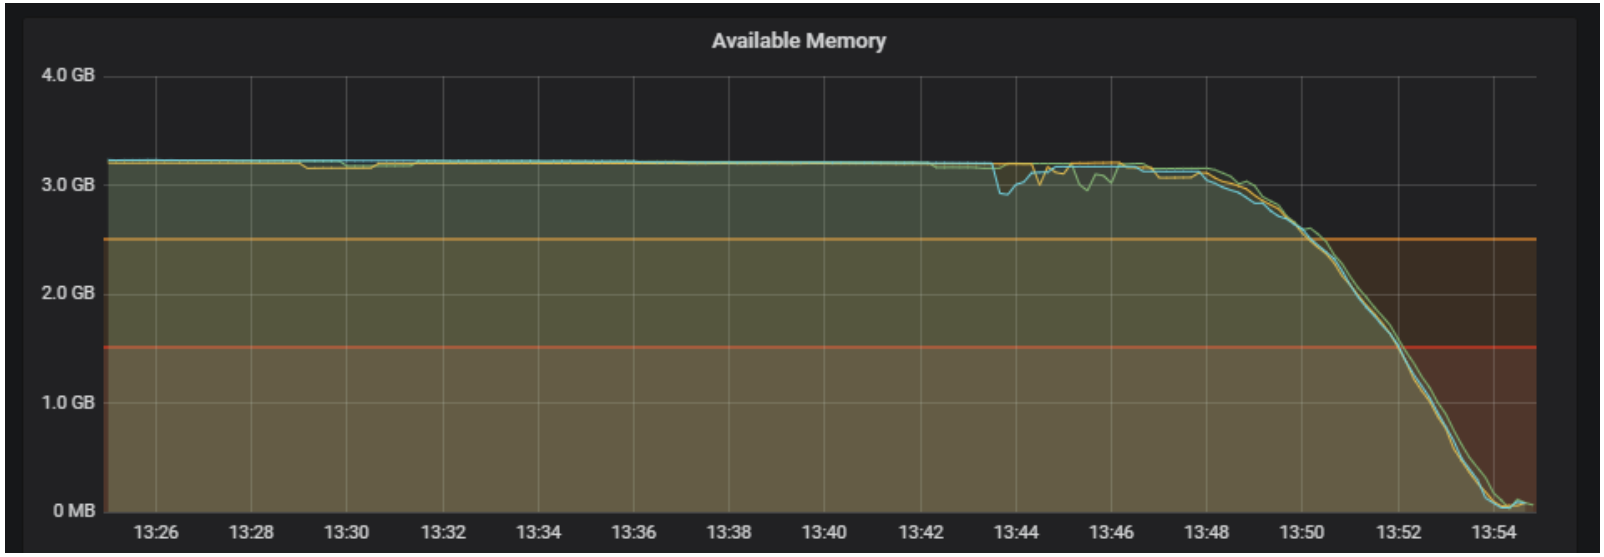
Figure 1 shows the available memory remaining on our EC2 instances for a component. The amber and red lines show our warning and critical states retrospectively. Each of the remaining coloured lines each indicates a single EC2 instance, each of which experiencing serious memory issues and hitting a critical state after less than 10 minutes of load.
How to implement LTDD using JMeter
For LTDD, we need to define a test plan using JMeter. A test plan is simply a series of steps that the load testing server will take. For demonstration purposes, we’ll be creating a test plan that starts a user-defined number of threads, each thread will be reading a route and an ID from a CSV file and making a GET request to our endpoint using these values. This will be on a loop, cycling through the CSV, such that it can hit many endpoints. Each request will be handled by a response assertion to ensure that there is a 200 response.
What you’ll need
Fakeload – When set up on a server, this will run your plan.
JMeter – This is the tool we will be using to generate a plan.
Using JMeter to create a test plan
When you first open JMeter, you should be greeted with this page:
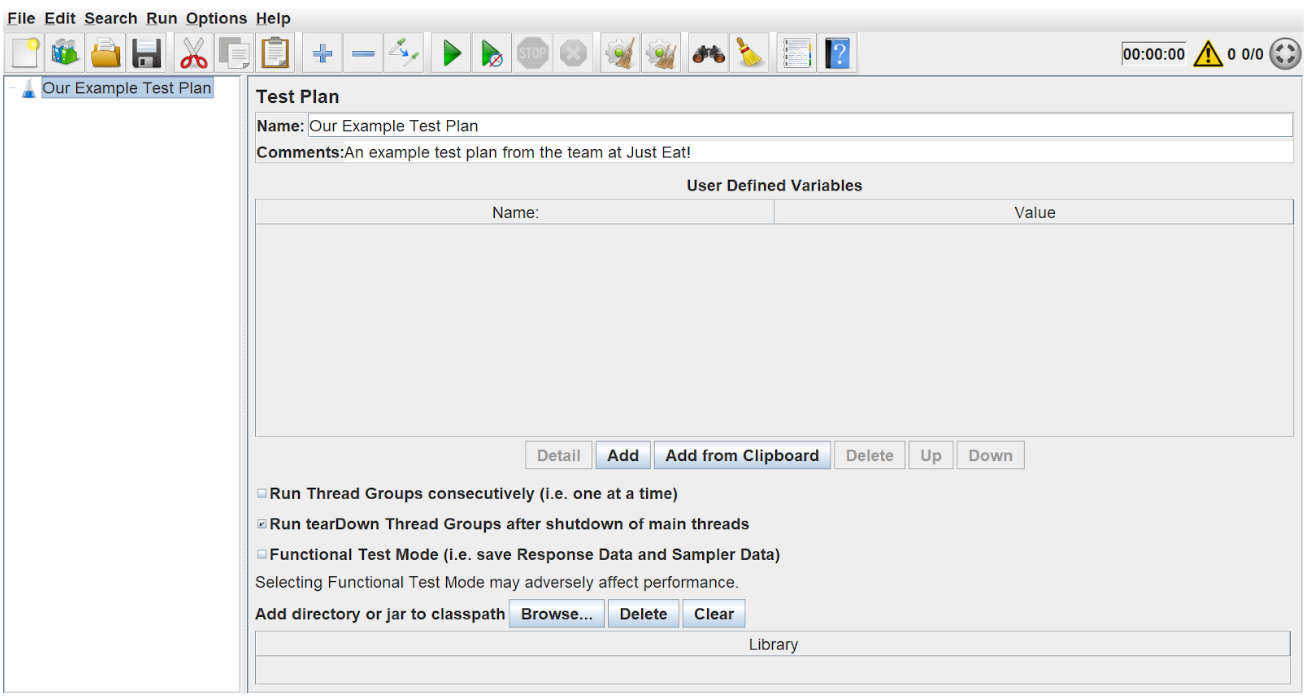
- Change your plan name and description using the name and comments boxes, then click ‘File’->’Save as’
- Create a new folder for this, as we will be storing our endpoint/IDs CSV here later.
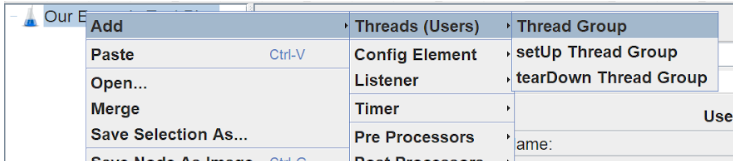
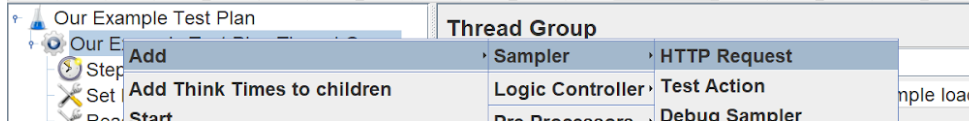
Now we can proceed to make a thread group, simply right-click on the test plan and follow the menus. This is just a set of threads that are executing the same scenario.
We want to configure this thread group to use a user-defined number of threads and ramp-up period to allow for any server auto-scaling.
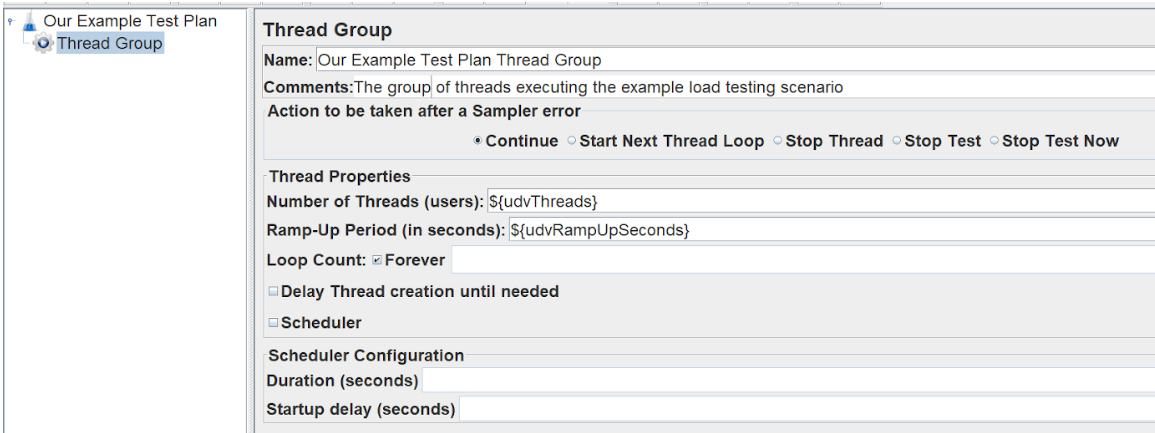
Notice we’re using user-defined variables in the thread properties. These are defined in our root plan file.
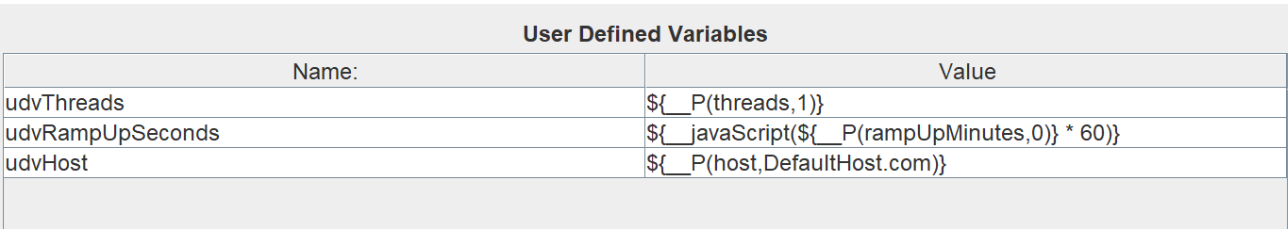
__P(PropertyName, DefaultValue) is the method to access properties. Properties are different to variables in that they’re shared across all of the executing threads.
To store our properties, we need a plan.yaml file. Using the same file name as your JMX file, create a file in your plan directory called [jmx file name].plan.yaml and add:
plans:
  - params:
      threads: 5
      host: myexamplehost.com
      rampUpMinutes: 0
We now have the foundations of our test plan ready. Now we need to start looking at how the threads will execute and interact with the endpoint.
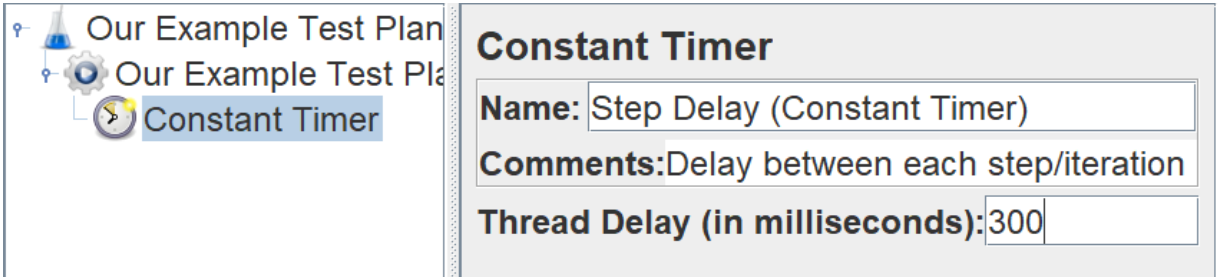
Firstly, we’ll think about the timing between each iteration, let’s add a Step Delay to the thread group using a constant timer.
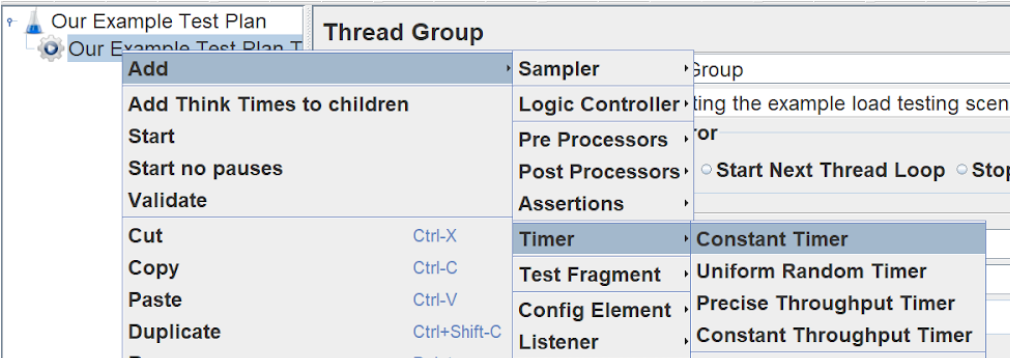
We’ve altered the name and comments/description, but the thread delay defaults to 300 milliseconds. We’ll keep this at 300ms for now, but we could make it into a variable or random later. To make this random, you can simply use ‘$(__Random(low, high))’
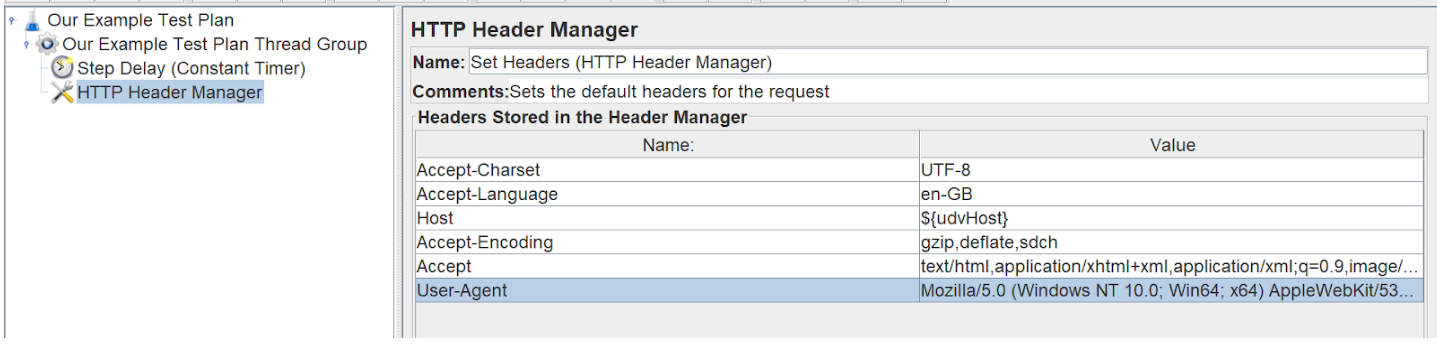
Next, we need to think about the request itself. We’ll start by setting the request headers. We can do this using an HTTP Header Manager.
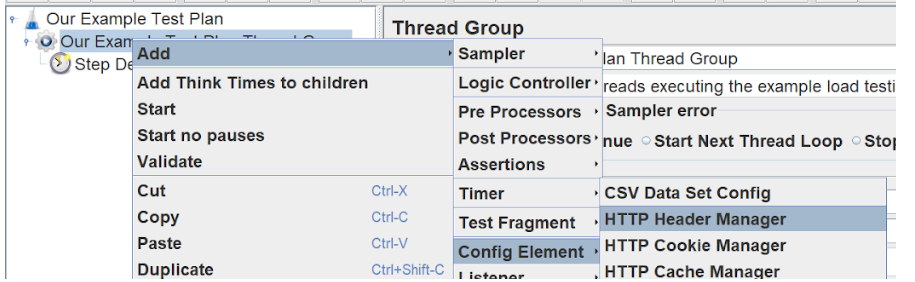
We’ve added a series of defaults to this, you may not need all these. It will depend on your endpoint.
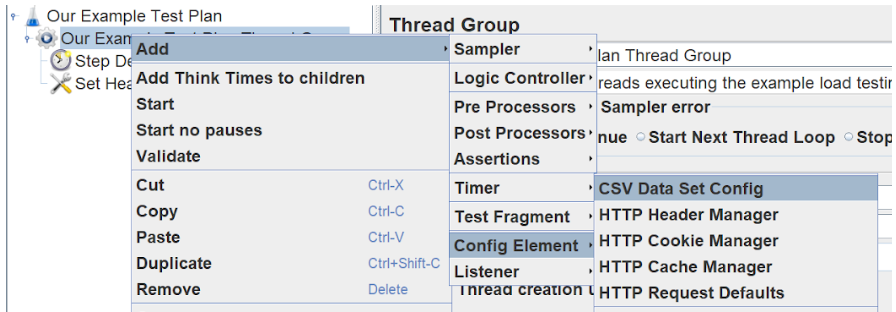
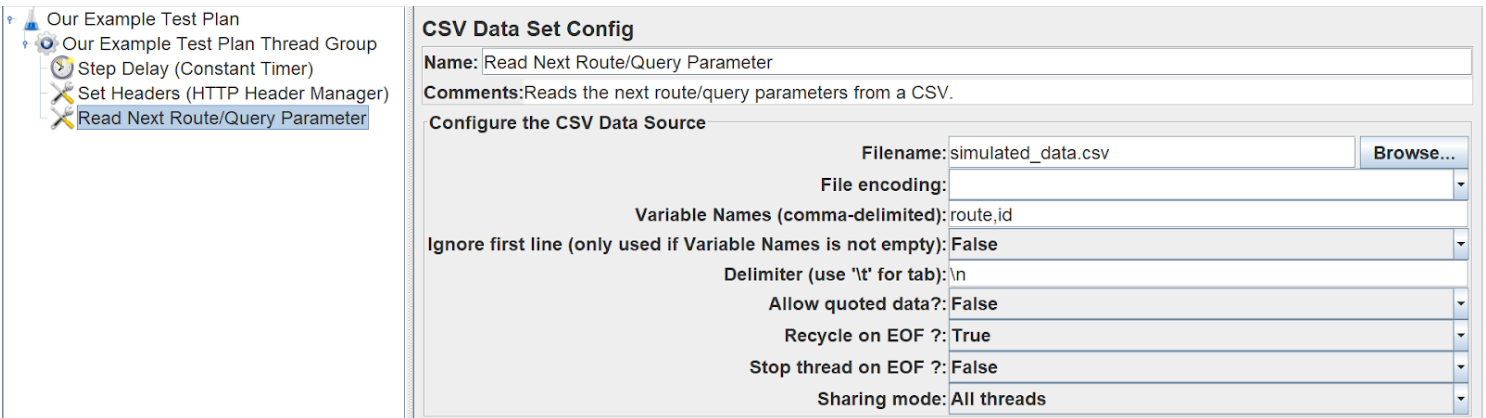
Next, we need to parse any query parameters or routes into our request URL. We’re going to build a CSV with realistic data later in this tutorial, but for now, we will just create a CSV file and read basic data from it. To do this, we need to add a CSV Data Set Config.
Set the filename to be relative to your JMX file. For simplicity, we will keep them in the same directory. Next, list the variable names of your values, as they will be represented in your CSV, this will allow you to use them in the request.
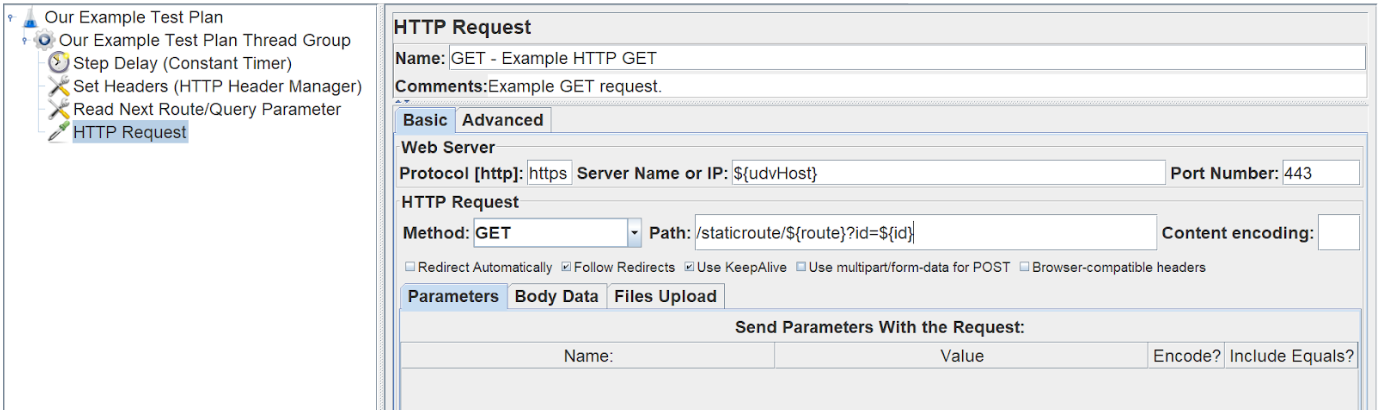
Next, we need to create the HTTP request.
For our basic GET request, we only need to fill in the basic details. Set the protocol to http/https then set the server name to be the host defined in your user-defined variables. Set the request method to GET and set your port and path. The path can be built using the variables gained from your CSV file.
This, for example, would hit the following endpoint: ourUserDefinedHost.com/staticroute/csvDefinedRoute?id=csvDefinedId
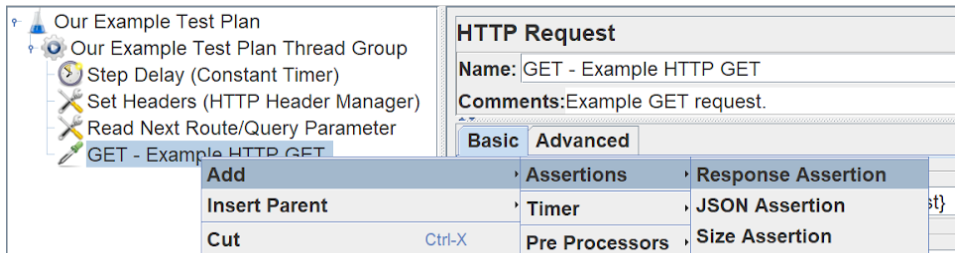
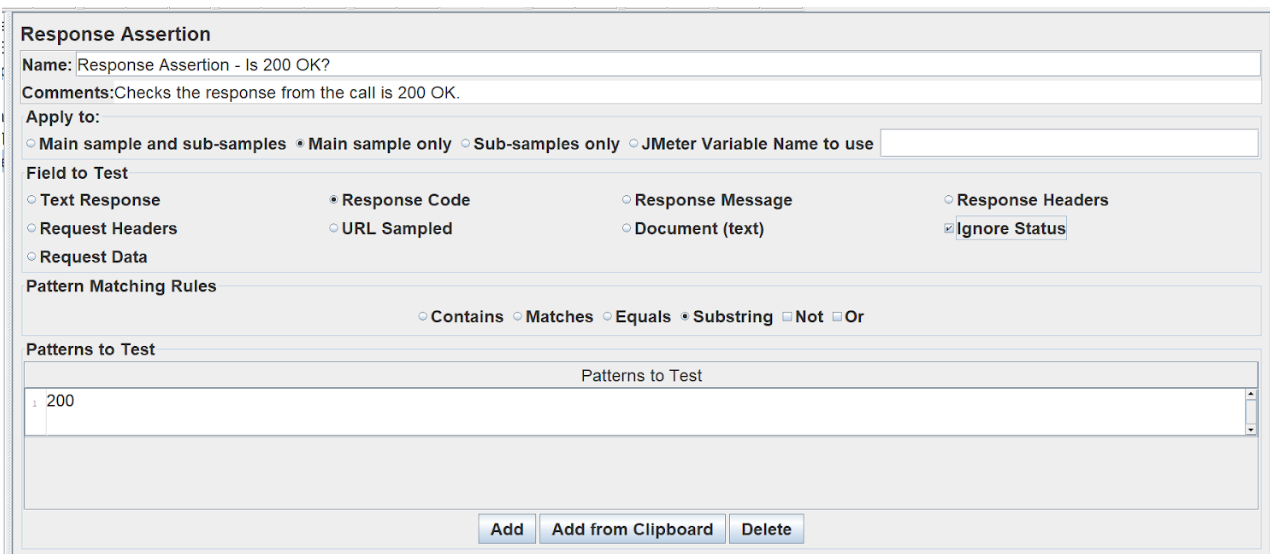
When we have a populated CSV, this should successfully send requests. We want to check that the response from these requests is valid and not failing. In this instance, we’ll be checking if the HTTP response is 200 OK. To do this, we need to create a response assertion that tests the ‘Response Code’ and checks it to include ‘200’.
Finally, we will need a listener to listen to the response and reveal any issues/errors whilst we’re developing our load tests. It’s worth disabling it during load tests as they consume a large amount of memory.
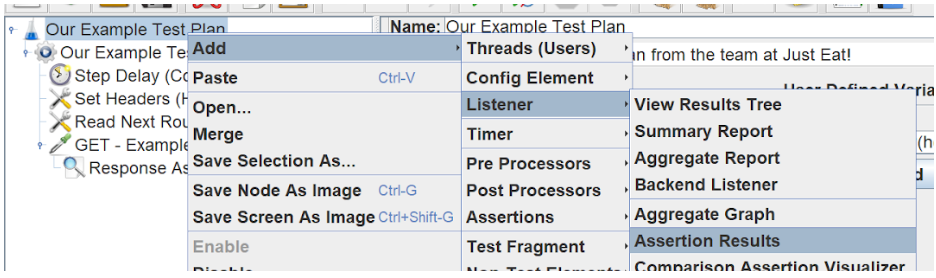
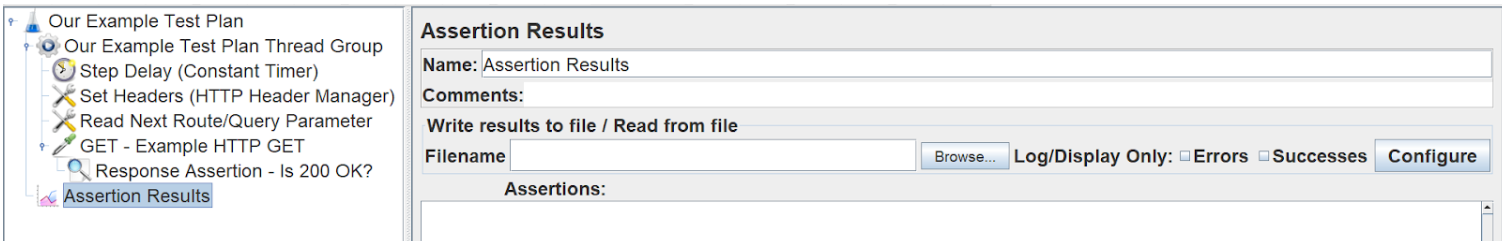
The listeners require little/no configuration and the plan can now be run in JMeter and any errors can be flagged for debugging by watching the listener components logs.
Defining a Great CSV test file
If you want to simulate real traffic, this can be done by having a realistic test data set stored in your CSV. It’s important to consider traffic patterns and which endpoints get the most traffic. If you have an existing application or services running, use metrics from these to predict how your endpoint will be used.
Let’s assume we have an endpoint that returns product information. We could simply rotate through a product list CSV and request each item an equal number of times in turn, but this is highly unrepresentative of real traffic.
Let’s assume that:
- 25% of pages, get 50% of total traffic, such as the home page, landing pages and most popular products (A pages).
- 50% of pages receive another 40% of the total traffic, such as individual products (B pages)
- The final 25% of pages only get 10% of the remaining traffic, such as info pages, reviews, policies and such (C pages).
From this, let’s create a representative CSV file that will hit a range of endpoints, for simplicity, we’ll assume there are only 100 possible endpoints and 1000 lines in this CSV and it loops. We will also assume every page is hit at least once.
- 500 of these lines will be for our 25 A pages, 400 will be our 50 B pages, and 100 will be our 25 C pages.
If we randomise the order of these pages, we can evaluate the effectiveness of our system, and in particular, see the performance gains through caching implementations and optimisations.
Evaluating the results to become more performant
Once you’ve run your load tests against your endpoint it is important to evaluate the performance. Implementing a monitoring stack and using tools like Grafana can help you to visually see the performance of your endpoints and make quick comparisons to acceptable performance thresholds. Comparison between metrics such as average response time, requests per second/minute and Apdex (Application Performance Index) are key to measuring performance gains or loses.
Use these metrics to ask yourself the following questions:
- How many requests can our endpoint handle now compared to what it will need to handle at peak?
- How is the business evolving? If you experience a period of growth, does the server have remaining headroom be able to match that demand?
If your endpoint is not as performant as it needs to be, set targets to improve and make the endpoint as performant as possible to exceed your demand at the minimum cost to the business.
Further to this, load tests provide a benchmark to compare future changes. When you make an implementation or configuration change, re-run the load tests. If the performance significantly degrades, the change will need rolling back until the performance loss is isolated and resolved.
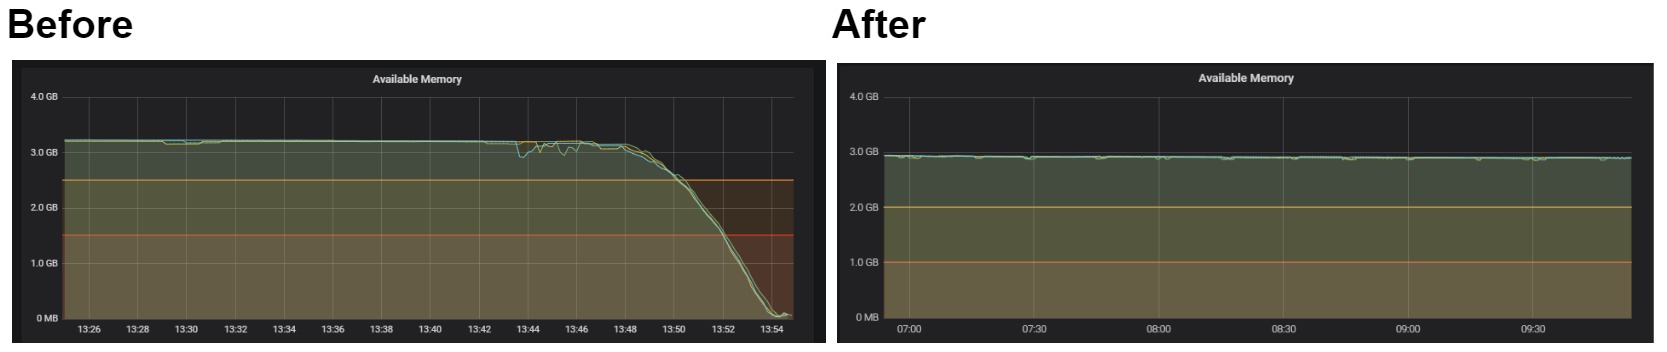
From using this methodology in early development, we modified our system architecture to receive these results: